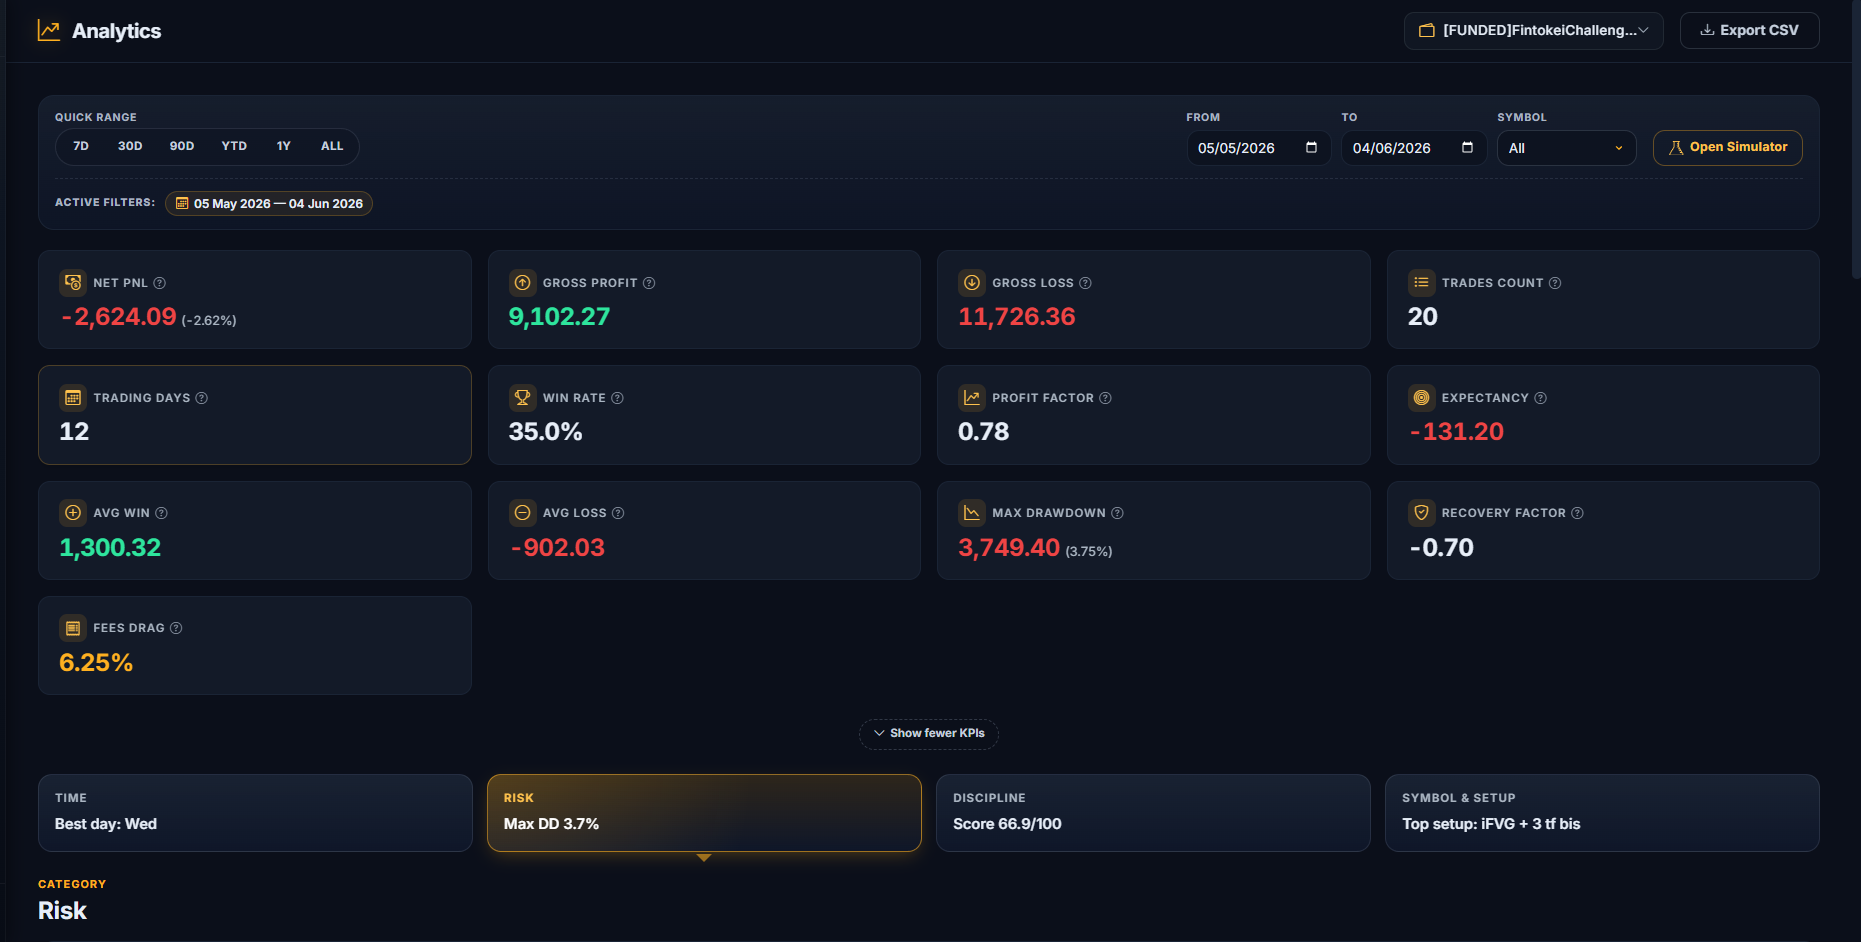
Product interface · recorded example. Click to open at full size.
The Analytics page turns your trades into breakdowns you can act on. It opens on the last 30 days by default and is available on every plan.
Filters
Account scope — one account, or several compatible accounts merged together.
Date range — quick presets (7d, 30d, 90d, YTD, 1y, All) or a custom From/To.
Symbol — all symbols or a specific one.
KPI cards
The top strip shows headline numbers — Net PnL, gross profit/loss, trades, trading days, win rate, profit factor, expectancy, average win/loss, max drawdown and more (“Show more KPIs” reveals the rest).
The trading performance metrics guide explains how to read expectancy, profit factor and drawdown beside review coverage and plan adherence instead of treating win rate as a complete score.
The four tabs
Time — best/weakest time windows and weekdays, a calendar heatmap, PnL by day of week and month, and breakdowns by day/week/month/quarter/session.
Risk — risk overview, streaks, drawdown behavior, risk per trade and by weekday, post-loss behavior, plus equity and drawdown charts.
Discipline — Behavior and Process scores, review coverage, priority mistake, observed comparisons, and mistake/execution/emotion tables.
Symbol & Setup — top symbols, long vs short, a setup × symbol matrix and a setup breakdown.
Tip
Weak time blocks and weekdays link straight into the Rule Simulator, so you can test a rule against the pattern you just spotted. You can also export your data to CSV from the toolbar.